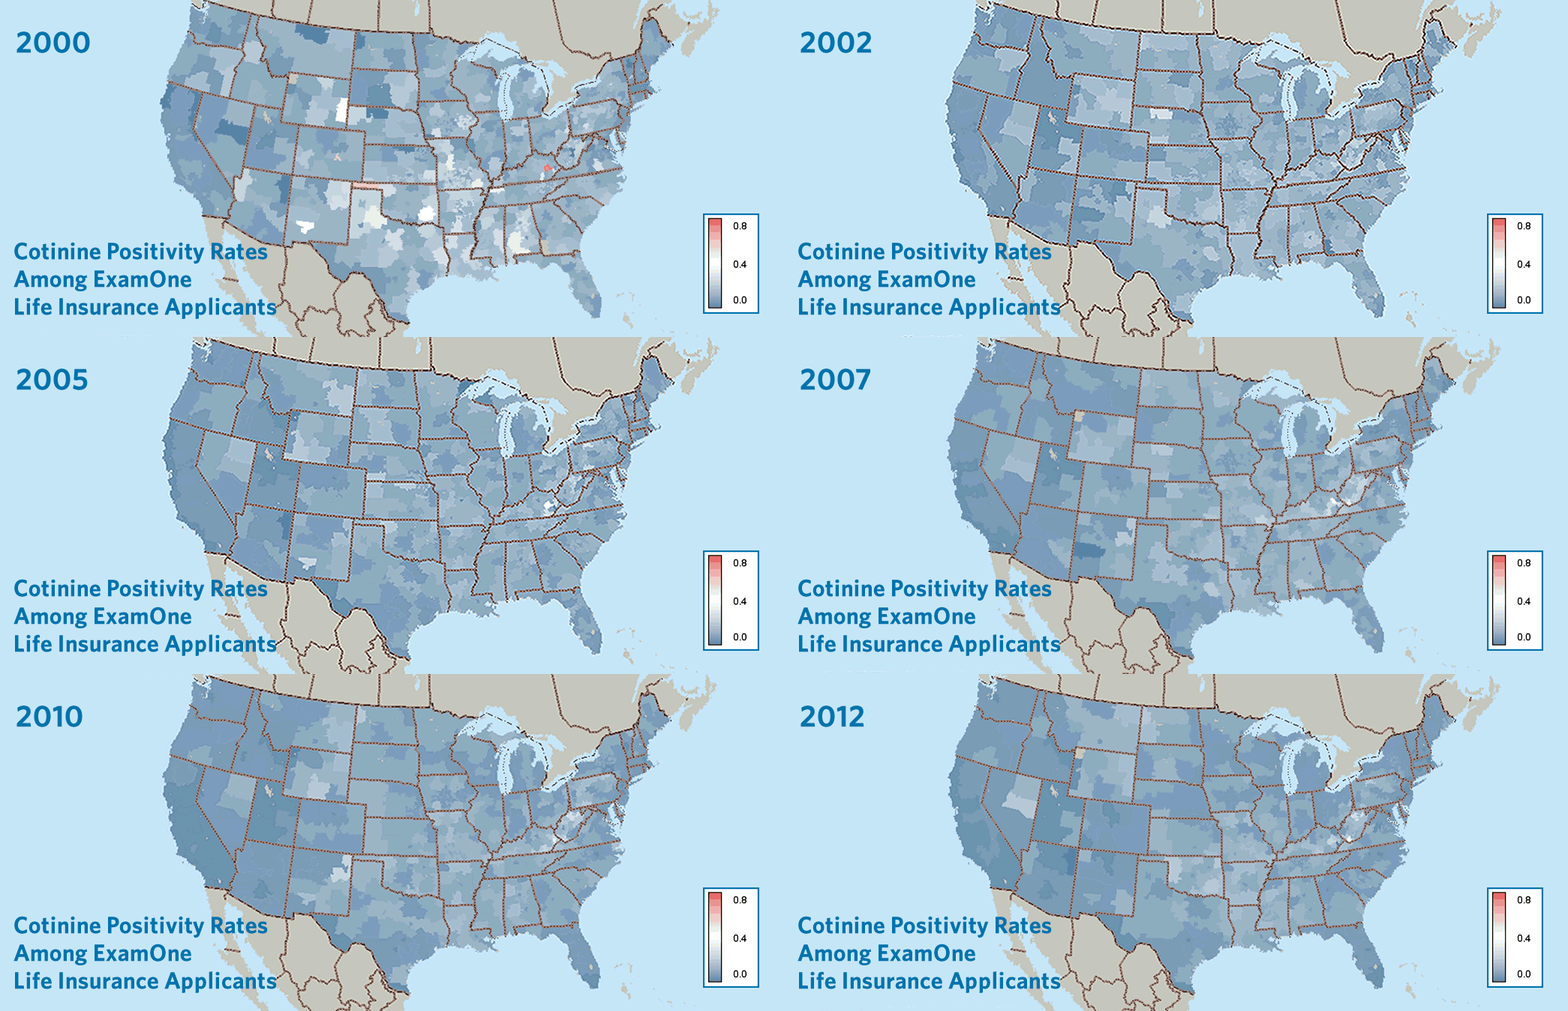
It is important to know the cotinine positivity rates of a life insurance applicant during a typical life insurance underwriting process. An applicant’s cotinine positivity rate, when correctly captured, is useful in classifying smoking and non-smoking premium rates. In most cases, smokers pay rates as high as three times the premium of non-smokers and this has become a very strong motivation for more and more life insurance applicants to lie about their smoking status during application process. Determining the correctness of reported tobacco usage by applicants therefore continues to attract attention within the life insurance industry. Cotinine positivity distribution maps as shown below, provides a quick reference to underwriters and life insurance risk assessors on the trends and distribution patterns of tobacco usage among life insurance applicants across the United States. The report also notes the states where to potentially expect relatively higher cotinine positivity rates among life insurance applicants across the country.
Results
The results for cotinine positivity rates across the United States as analyzed from ExamOne life insurance applications data from years 2000 – 2012 are summarized as follows:
– ExamOne life insurance applicant data for the 12 year period downscaled to a 3-digit zip code level were analyzed.
– The data shows significant increase in number of life insurance applications processed at ExamOne from about 300, 000 in year 2000 to about 1.5 million in year 2012.
– On average, analysis shows a generally decreasing trend over those 12 years in cotinine positivity rates across the United States. Average nationwide cotinine positivity rate was shown to be about 11-12% per year and gradually decreased to about 8% in 2012.
– Over the 12 year period – East central Kentucky recorded the highest cotinine positivity rates of about 70% (in the year 2000); Oklahoma Panhandle recorded highest cotinine positivity rates of about 50% also in the year 2000.
– Texas, New Mexico, eastern Wyoming, Arizona, Nevada, Missouri, Iowa, Louisiana, Alabama, Virginia and West Virginia, Montana all recorded relatively higher cotinine positivity rates ranging from 20 – 50% during this timeframe. When compared with other states, Pennsylvania and Nebraska recorded a relatively lower cotinine positivity rate of about 18 and 15% respectively during the same period.
Our record shows a generally decreasing trend in cotinine positivity rates among life insurance applicants – those who were tested for cotinine positivity by ExamOne between 2000 – 2012. Eastern Kentucky, Oklahoma Panhandle and New Mexico recorded relatively higher cotinine positivity rates when compared with the rest of the states during the 12 year period. This information provides an overview of where to expect a higher likelihood of tobacco using life insurance applicants’ across the United States.










It is important to know the cotinine positivity rates of a life insurance applicant during a typical life insurance underwriting process. An applicant’s cotinine positivity rate, when correctly captured, is useful in classifying smoking and non-smoking premium rates. In most cases, smokers pay rates as high as three times the premium of non-smokers and this has become a very strong motivation for more and more life insurance applicants to lie about their smoking status during application process. Determining the correctness of reported tobacco usage by applicants therefore continues to attract attention within the life insurance industry. Cotinine positivity distribution maps as shown below, provides a quick reference to underwriters and life insurance risk assessors on the trends and distribution patterns of tobacco usage among life insurance applicants across the United States. The report also notes the states where to potentially expect relatively higher cotinine positivity rates among life insurance applicants across the country.
Results
The results for cotinine positivity rates across the United States as analyzed from ExamOne life insurance applications data from years 2000 – 2012 are summarized as follows:
– ExamOne life insurance applicant data for the 12 year period downscaled to a 3-digit zip code level were analyzed.
– The data shows significant increase in number of life insurance applications processed at ExamOne from about 300, 000 in year 2000 to about 1.5 million in year 2012.
– On average, analysis shows a generally decreasing trend over those 12 years in cotinine positivity rates across the United States. Average nationwide cotinine positivity rate was shown to be about 11-12% per year and gradually decreased to about 8% in 2012.
– Over the 12 year period – East central Kentucky recorded the highest cotinine positivity rates of about 70% (in the year 2000); Oklahoma Panhandle recorded highest cotinine positivity rates of about 50% also in the year 2000.
– Texas, New Mexico, eastern Wyoming, Arizona, Nevada, Missouri, Iowa, Louisiana, Alabama, Virginia and West Virginia, Montana all recorded relatively higher cotinine positivity rates ranging from 20 – 50% during this timeframe. When compared with other states, Pennsylvania and Nebraska recorded a relatively lower cotinine positivity rate of about 18 and 15% respectively during the same period.
Our record shows a generally decreasing trend in cotinine positivity rates among life insurance applicants – those who were tested for cotinine positivity by ExamOne between 2000 – 2012. Eastern Kentucky, Oklahoma Panhandle and New Mexico recorded relatively higher cotinine positivity rates when compared with the rest of the states during the 12 year period. This information provides an overview of where to expect a higher likelihood of tobacco using life insurance applicants’ across the United States.